Google Analytics Integration in Mewayz (Formerly Seemless)
The Google Analytics Add-On allows users to integrate powerful tracking and reporting tools directly into their workspace.
Introduction
The Google Analytics Add-On allows users to integrate powerful tracking and reporting tools directly into their workspace. With this integration, users can monitor website traffic, user behavior, conversion rates, and other essential metrics without needing to leave the platform. It provides detailed insights into visitor interactions, helping users make informed decisions based on real-time data. Whether tracking campaign performance or understanding audience demographics, this Add-On simplifies data access and visualization through intuitive dashboards and reporting tools.
How to Install the Add-On?
To set up the Google Analytics Add-On, you can follow this link: Setup Add-On.
Note: This Add-On only has access to Super Admin, which means only Super Admin can use this Add-On.
How to use the Google Analytics Add-On?
- Once you complete the purchase of the Google Analytics Add-On, log in to the super admin panel of
- Navigate to the Settings page from the side menu and locate the Google Analytics Settings section
- Google Analytics Settings section in the Enter Pixel ID for tracking and analytics.
- Upload the .json credentials file that you previously downloaded from your Google Cloud Console to
- The steps of how to generate the Google JSON file are mentioned below, you can follow them and
your platform to begin the configuration process.
under integrations.
authorize the connection.
generate the file easily.
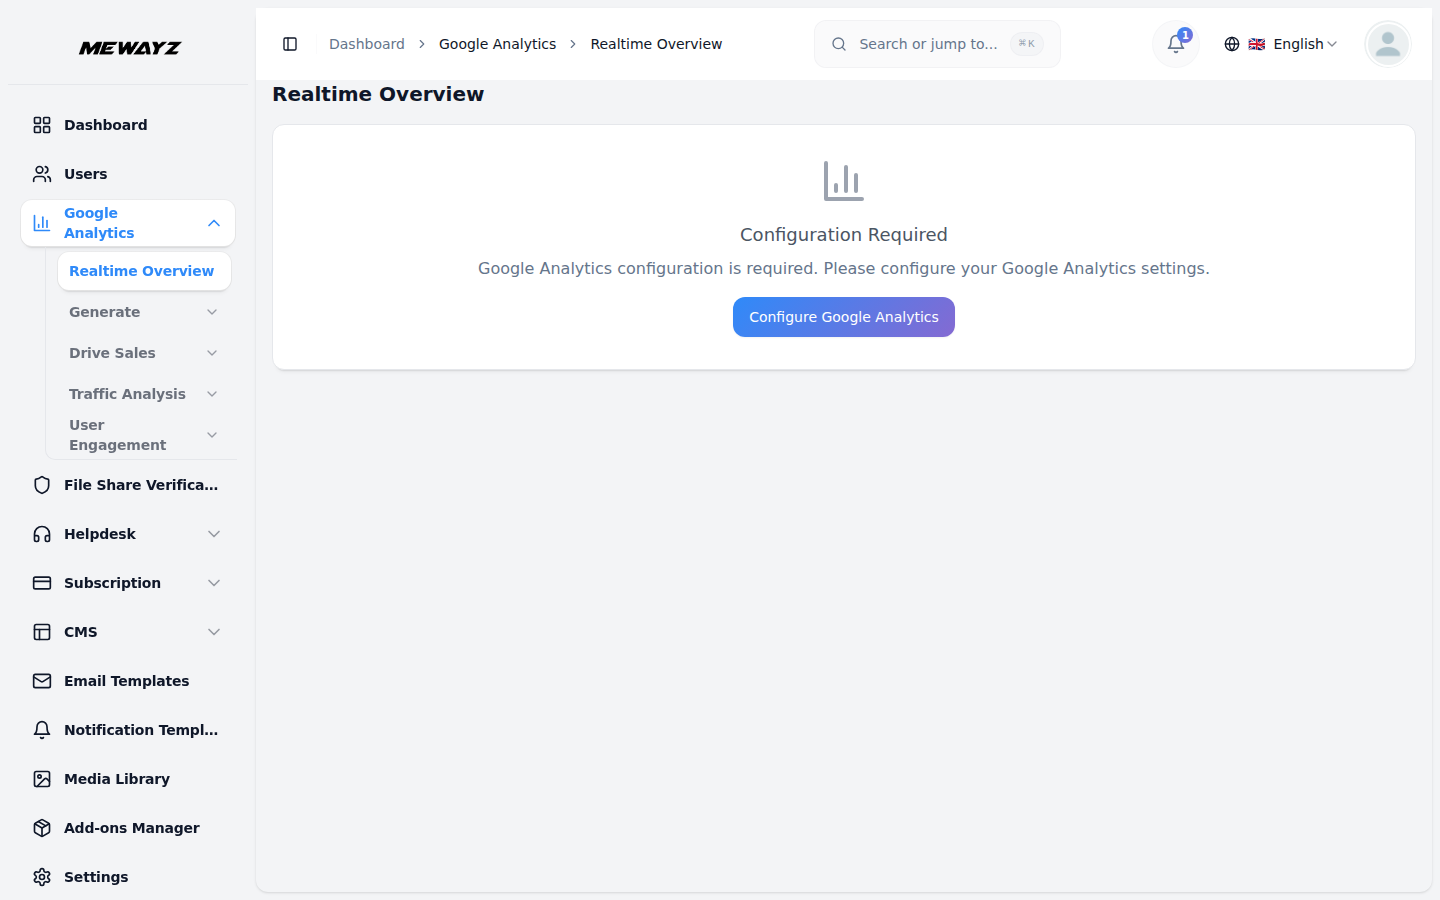
Accessing The Google Analytics Add-On
- After successfully setting up your credentials and pixel ID, use the sidebar navigation to find
- You will now see multiple sections organized under:
- Real-Time Overview
- Generate
- Drive Sales
- Understand Web/App Traffic
- OverviewEach contains detailed subpages for specific analytics metrics.*
and click on the Google Analytics Add-On.
Real-Time Overview Section
- This section provides a visual map showing active users by country based on data from the last 28
- Alongside the map, you’ll see metrics for the number of currently active users and a real-time
- A chart is available displaying Google Analytics sessions tracked over the last 7 days for
- You’ll also find a complete list that displays events triggered, categorized by their event name.
days, helping you understand your global reach.
count of views from the last 30 minutes.
short-term performance insights.
Generate Section
- In the Overview subpage, you’ll find a chart showing new users over time, and you can view metrics
- A list labeled New Users by Source helps identify how many users have arrived from different
- A separate list titled Active Users by City presents geographic segmentation based on recent user
- Another key report, Active Users by Audience, lets you identify user categories like new users,
- The Audience subpage contains a time-based chart showing how various audiences are interacting
- In the Landing Page subpage, you can review session activity over time for your landing pages,
- The User Acquisition subpage displays a timeline chart of total users by their First User Primary
- Lastly, the User Acquisition Cohorts page provides a similar view, specifically focused on new
for total new users, total sessions, and currently active users on your platform.
platforms and campaigns.
activity.
returning users, total session counts, and the number of users on desktop devices.
with your platform, along with a summary of audience data collected over the past 28 days.
followed by a detailed list of individual session entries.
Channel Group and includes a list of corresponding user entries categorized by the same channel group.
users, offering both a chart and a list segmented by the default channel group.
Drive Sales Section
- In the Overview subpage, you can monitor your store’s performance by viewing metrics such as total
- Below this, several detailed reports help you analyze item purchases categorized by item name,
- The E-commerce Purchases page shows how frequently items were viewed, presented as a timeline
- In the Promotions page, you can examine how effective your promotions were by reviewing a chart of
- The Purchase & Checkout Journey page gives you insights into your users’ path to purchase by
- The Transactions page presents a graph illustrating purchase revenue over time, categorized by
revenue, total ecommerce purchases, and average revenue per user.
purchases influenced by order coupons, and purchases segmented by item list name.
chart, followed by a detailed list of item names and corresponding view counts.
items viewed under specific promotions and a list containing detailed promotional item data.
displaying session counts for key ecommerce actions such as product views, add-to-cart events, checkout initiations, and completed purchases.
transaction ID, and a table listing the exact transactions included.
Understand Web And App Traffic Section
- The Overview page here shows your average engagement time per user, total engaged sessions, and a
- It also provides top-level insights like the most active countries and cities, the most triggered
- Additional visual data includes a User Stickiness chart showing user retention trends, and a pie
- The Demographic Details page displays a timeline chart of active users segmented by country and a
- The Pages & Screens page offers a graph that tracks views by page path and screen class over time,
live count of active users currently on your platform.
events, and your highest-performing pages.
chart that segments active users based on language preferences.
table showing demographic metrics per country.
followed by a list view of that data.
Final Overview Section
- The Overview subpage under this section shows the number of currently active users and new users
- You’ll also find a list displaying views broken down by page title for deeper content-level
- The Events subpage provides a visual timeline of event counts by event name, and a complete list
- The final Pages & Screens page presents a 28-day view chart of page and screen visits, followed by
gained, along with a list of new users categorized by their channel group.
analysis.
of those events sorted accordingly.
the associated list view.
How To Set Up Google Analytics Data API And Enable Access
Step 1: Create A Google Analytics Account
- Visit: Google
- Click on “Start Measuring” to begin the account creation process.
- Set up an account name and property (e.g., “Mewayz (Formerly Seemless)”).
- Configure data sharing settings and finish setup.
Analytics
Step 2: Enable Google Analytics Data API
- Go to Google Cloud Console.
- Select or create a project.
- Navigate to APIs & Services > Library.
- Search for Google Analytics Data API.
- Click Enable.
Step 3: Create and Configure a Service Account
- In Google Cloud Console, go to **IAM & Admin > Service
- Click Create Service Account.
- Enter a name (e.g., Mewayz (Formerly Seemless)-under-access), and click **Create and
- Assign roles (you can skip this if only Viewer access is needed on GA).
- Finish creation.
- Generate a .json key file and save it securely. This contains your credentials.
Accounts**.
Continue**.
Step 4: Grant Access to the Service Account in GA4
- Open Google Analytics.
- Go to your GA4 property (e.g., “Mewayz (Formerly Seemless)”).
- Click Admin (bottom left corner).
- Under Property, click Property Access Management.
- Click the blue plus (+) button and select Add Users.
- Open your .json credentials file and copy the value for “client_email”. It looks like:
your-service-account-name@your-project-id.iam.gserviceaccount.comPaste this email into the Add users field.
- Grant it at least the Viewer role (or Analyst for extended access).
- Click Add to complete.
How to Enable or Install the BCMath PHP Extension
1. Create a Google Analytics Account:
- Go to: https://analytics.google.com/
- Click on “Start Measuring” to begin setting up your account.
- Enter your Account Name and Property Name (for example, “Mewayz (Formerly Seemless)”).
- Complete all steps in the setup wizard.
2. Enable Google Analytics Data API
- Visit: https://console.cloud.google.com/
- Select an existing project or create a new one.
- Go to: APIs & Services → Library
- Search for: “Google Analytics Data API”
- Click: “Enable.”
3. Create a Service Account
- In the Cloud Console, go to: IAM & Admin → Service Accounts
- Click: “Create Service Account.”
- Enter a name (e.g., lead-under-access), then click “Create and Continue.”
- (Optional) Assign a role. You can skip this if roles will be assigned directly in
- Click: “Done.”
- Create and download a .json key file. This contains your service account
GA4.
credentials.
4. Grant Access to the Service Account in GA4
- Go to: https://analytics.google.com/
- Open your GA4 property (e.g., “Leads”).
- Click: “Admin” in the bottom-left corner.
- Under the “Property” column, click “Property Access Management.”
- Click: the blue plus (+) icon and choose “Add Users.”
- Open your .json file and copy the “client_email” value. It looks like this:
- Paste that email in the Add users field.
- Grant at least the “Viewer” role (or “Analyst” for full reporting access).
- Click: “Add.”
your-service-account-name@your-project-id.iam.gserviceaccount.com.
Enable or Install BCMath PHP Extension
- For Ubuntu/Debian (Linux):
- Run this command:
sudo apt-get install php-bcmath - Restart your web server:
sudo service apache2 restartor
sudo service php7.x-fpm restart
For macOS (with Homebrew):
- Run: brew install php
- BCMath is included by default in Homebrew’s PHP installation.
For Windows:
- Open your php.ini file.
- Find the following line: extension=bcmath
- Remove the semicolon so it looks like this: extension=bcmath
- Save the file.
- Restart your web server (Apache, Nginx, etc.)
To verify BCMath is enabled:
- Run the following command in your terminal or command line: php -m | grep bcmath
- If “bcmath” appears in the output, the extension is enabled.